Graph, cellphone, and thumbs showing the ecommerce analytics metrics to optimize for

The Ecommerce Analytics Metrics That Matter (and the Ones That Don’t)

Missing your quarterly ecommerce targets is frustrating. Not knowing why you’re missing them is even worse. It could be your search engine or product descriptions, or it could be something outside of your control, like a dip in the market

But your problem could be even more basic: having the wrong ecommerce analytics metrics.

Picking the right metrics makes a huge difference to your bottom line. A few good ecommerce success metrics tell you more about your business than a thousand bad ones. But it’s hard to pick between hundreds of metrics while balancing company and customer needs.

To help you pick the right ecommerce analytics metrics for your company, we’re covering:

  1. What makes an ecommerce analytics metric right for you
  2. What mistakes you should avoid when picking metrics
P.S. Looking specifically for online grocery KPIs? We’ve got you covered.

What Are Good Ecommerce Analytics Metrics to Measure?

Most ecommerce companies use a few metrics that are universally recognized as effective. But these metrics are useful because they share a few qualities.

They support your company’s goals

The right ecommerce analytics metrics are always based on valid business goals, usually based on your top-line revenue, net profit, or growth over a set period of time. 

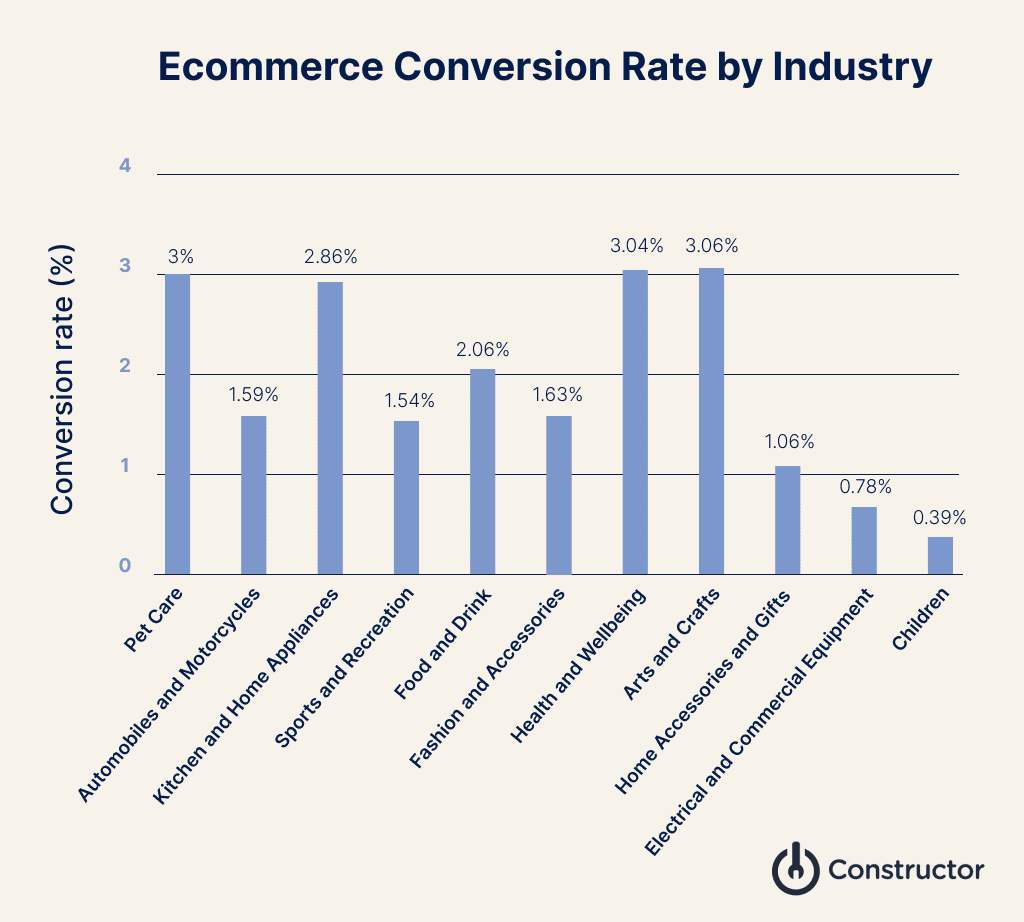
Companies break broad business goals into annual or quarterly OKRs, then divide those into individual targets for each department. Each target is measured either quantitatively or qualitatively. For quantitative targets, common ecommerce KPIs to measure success include conversion rate (CR), average order value (AOV), and others.

It’s important that all these metrics and KPIs feed upwards, supporting overall company goals.

Ecommerce conversion rate by industry.

They’re closely related to the point of purchase

The ultimate aim of any ecommerce company is to make money by serving its customers. A good metric should be closely linked to point of purchase because those metrics are usually more informative and specific. 

Website visitors per month doesn’t tell you much about who is coming or if they will buy anything. There usually are many steps and decisions a buyer must take from home page to transaction page.

Ecommerce customer journey

But divide your website visitors per month by the number of people buying and you get a conversion rate. The conversion rate tells you how many visitors coming to your website are actually buying your products. 

This doesn’t mean that measuring the number of website visitors a month is pointless. It’s just that it must be understood along with ecommerce success metrics like number of transactions in the same timeframe to be informative or actually speak to business goals. The number of visitors isn’t directly related to revenue—the number of purchases is.

They are time-sensitive

An easy way to gain insight from an ecommerce analytics metric is to measure it over a specific period of time, but changes month over month (or season over season) might not always tell you the whole story. 

Why? Because ecommerce is highly seasonal. What customers purchase at the end of October is certainly not what they tend to purchase during Black Friday weekend just a month later.

Wise interpretation of metrics is absolutely essential here to drive business decisions. Instead of relying on data that requires pre/post analysis, testing big changes like a new discovery platform in a more controlled experiment can give you more insight into how those changes actually drive results. 

They are actionable

Actionable metrics are metrics that connect your actions to observed results. It’s frustrating when a leading indicator like adds to cart don’t convert to sales. Your cart abandonment rate tells you how many potential buyers are leaving their cart items unpurchased just as they’re about to pay.

Ecommerce success metrics including Add-to-cart

Analyzing this ecommerce analytics metric forces you to investigate the reasons why customers are leaving. It could be uncertainty about a return policy, high shipping fees, or a long checkout process. With this knowledge, you can then take steps to ensure that fewer people are leaving their carts.

They are contextually relevant

In today’s omnichannel world, your expectations of your metrics must be relevant to the context you are selling in. A company like Sephora has a dedicated app whose design and features like NLP voice search make it distinct from its website.

A metric like homepage visits can be a vanity metric for Sephora’s desktop and mobile website. It doesn’t say where these visitors are from or what they want. But context is everything. If a lot of users have downloaded and opened the Sephora app homepage, they likely have higher conversion rates than the website.

Common Mistakes to Avoid in Analyzing Ecommerce Metrics

Even good ecommerce success metrics can backfire if you use them incorrectly. But if you avoid these commonly made errors, you’re more likely to meet your revenue goals.

Missing the forest for the trees

Focusing on a metric without considering its overall impact is a mistake. Let’s say your quarterly goal is to increase conversion rate by 5%. You can increase conversion rate by boosting cheaper products with smaller margins.

It’s easy to misinterpret this as success, but selling cheaper products with smaller margins may also reduce your overall profit, which is likely your larger company goal. Pairing conversion rate with the metric it supports (profit) and viewing them in tandem can help you avoid losing money. 

Picking too many primary metrics

Trying to optimize for too many main metrics leads to information overload. It can also confuse your merchandising teams if your metrics are contradictory. Having too many metrics is a sign you’re not aligned with your company goals.

Of course, the total number of metrics is large if your company is large and sells products across many channels. But a few (well considered) top metrics allow all your downstream metrics to be more effective.

When focusing on multiple metrics, it’s important to think of the tradeoffs involved when you favor one over the other. For example, say a company wants to focus on increasing revenue and profit. In many cases, selling more low-margin products will increase revenue but may decrease profits. What is an acceptable tradeoff? Is that focus worth it? 

Focusing on vanity metrics

Some ecommerce analytics metrics seem to show progress, but don’t give you much insight to inform your future strategies. These vanity metrics are hard to avoid but easy to spot with a little bit of thought. 

Vanity metrics lack one or more of the qualities that good metrics have. They’re not close enough to business goals to have an impact on OKRs.

A good litmus for identifying a vanity metric is can you artificially inflate it without serving customer needs or the business goal? Many commonly used metrics fail this test. 

A good example of such a metric is percentage to PDP. On the surface, it measures how many visitors on your homepage find their way to a product detail page. But it’s easy to inflate by showing products that get more clicks but fewer purchases. While increasing the percentage to PDP, you may be attracting visitors who will never convert or who go to the wrong products.

Metrics Are Just the Beginning

Optimizing your ecommerce business is difficult because of the number of factors you have to adjust. But with a handful of measurable and actionable metrics linked to a definite goal, your ecommerce company is off to a good start.

Combine well-defined ecommerce analytics metrics with modern AI-based product search and discovery tools, and you can meet and exceed your revenue and profit goals.

2022 Ecommerce Trends: AI and Omnichannel Experience

ecommerce trends ebook cover

In this 38-page PDF, learn how forward-thinking ecommerce retailers are gaining advantage and driving revenue in 2022 by applying three main strategies: 

  • Hyper-personalization 
  • First-party clickstream data
  • Omnichannel product discovery and customer experience